 Dependencies are killing us
Let's start with some context: This is Banking with some serious legacy: Groups of "solutions" are bundled together as "domains". Each solution contains 5.000 to 10.000 modules (files), which are either top level applications (executable modules) or subroutines (internal modules). Some modules call code of other solutions. There are some system "libraries" which bundle commonly used modules similar to solutions. A recent cross check lists more than 160.000 calls crossing solution boundaries. Nobody knows which modules outside of one's own solution are calling in and changes are difficult because all APIs are potentially public. As usual - dependencies are killing us.
Graph Database
To get an idea what was going on, I wanted to visualize the dependencies. If the data could be converted and imported into standard tools, things would be easier. But there were way too many data points. I needed a database, a graph database, which should be able to deal with hundreds of thousand of nodes, i.e. the modules, and their edges, i.e. the directed dependencies (call or include).
Extract, Transform, Load (ETL)
While ETL is a concept from data warehousing, we exactly needed to "copy data from one or more sources into a destination system which represented the data differently from the source(s) or in a different context than the source(s)." The first step was to extract the relevant information, i.e. the call site modules, destination modules together with more architectural information like "solution" and "domain". I got this data as CSV from a system administrator. The data needed to be transformed into a format which could be easily loaded. Use your favourite scripting language or some sed&awk-fu. I used a little Ruby script,
ZipFile.new("CrossReference.zip").
  read('CrossReference.csv').
  split(/\n/).
  map { |line| line.chomp }.
  map { |csv_line| csv_line.split(/;\s*/, 9) }.
  map { |values| values[0..7] }. # drop irrelevant columns
  map { |values| values.join(',') }. # use default field terminator ,
  each { |line| puts line }
to uncompress the file, drop irrelevant data and replace the column separator.Loading into Neo4j
Neo4j is a well known Graph Platform with a large community. I had never used it and this was the perfect excuse to start playing with it ;-) It took me around three hours to understand the basics and load the data into a prototype. It was easier than I thought. I followed Neo4j's Tutorial on Importing Relational Data. With some warning: I had no idea how to use Neo4j. Likely I used it wrongly and this is not a good example.
CREATE CONSTRAINT ON (m:Module) ASSERT m.name IS UNIQUE;
CREATE INDEX ON :Module(solution);
CREATE INDEX ON :Module(domain);

// left column
USING PERIODIC COMMIT
LOAD CSV WITH HEADERS FROM "file:///references.csv" AS row
MERGE (ms:Module {name:row.source_module})
ON CREATE SET ms.domain = row.source_domain, ms.solution = row.source_solution

// right column
USING PERIODIC COMMIT
LOAD CSV WITH HEADERS FROM "file:///references.csv" AS row
MERGE (mt:Module {name:row.target_module})
ON CREATE SET mt.domain = row.target_domain, mt.solution = row.target_solution

// relation
USING PERIODIC COMMIT
LOAD CSV WITH HEADERS FROM "file:///references.csv" AS row
MATCH (ms:Module {name:row.source_module})
MATCH (mt:Module {name:row.target_module})
MERGE (ms)-[r:CALLS]->(mt)
ON CREATE SET r.count = toInt(1);
This was my Cypher script. Cypher is Neo4j's declarative query language used for querying and updating of the graph. I loaded the list of references and created all source modules and then all target modules. Then I loaded the references again adding the relation between source and target modules. Sure, loading the huge CSV three times was wasteful, but it did the job. Remember, I had no idea what I was doing ;-)
Querying and Visualising
Cypher is a query language. For example, which modules had most cross solution dependencies? The query
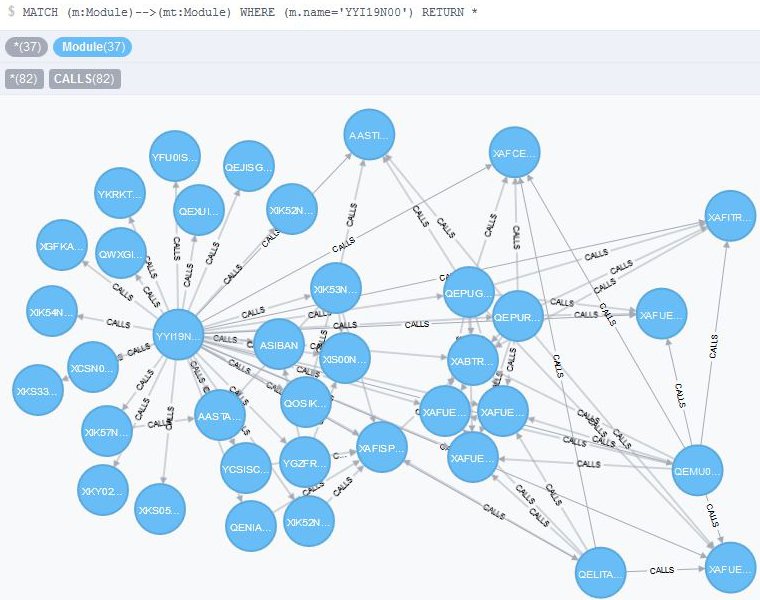
MATCH (mf:Module)-[c:CALLS]->() RETURN mf.name, count(distinct c) as outgoing ORDER BY outgoing DESC LIMIT 25 returnedYYI19N00 36 YXI19N00 36 YRWBAN01 34 XGHLEP10 34 YWI19N00 32 XCNBMK40 31and so on. (By the way, I just loved the names. Modules in NATURAL can only be named using eight characters. Such fun, isn't it.) Now it got interesting. Usually visualisation is a main issue, with Neo4j it was a no-brainer. The Neo4J Browser comes out of the box, runs Cypher queries and displays the results neatly. For example, here are the 36 (external) dependencies of module
YYI19N00:
As I said, the whole thing was a prototype. It got me started. For an in-depth analysis I would need to traverse the graph interactively or scripted like a Jupyter notebook. In addition, there are several visual tools for Neo4J to make sense of and see how the data is connected - exactly what I would want to know about the dependencies.


No comments:
Post a Comment