20 January 2020

Login Form TDD a UI Kata

User interfaces are usually considered hard to test, and people rarely develop their user interfaces using Test Driven Development. So it is considered hard. I like hard and I like challenges. I started to research the topic last year. Actually I went crazy. Besides my own experiments and practice, I hijacked most Coding Dojo and Coderetreat sessions and tried to TDD user interfaces with my pairing partners. I discussed the topic at unconferences and spent dedicated time with people in learning workshops. Besides its use I just wanted to see how far I could go.

This is the first article in a series describing what I learned. I spent more than half a year of my learning time on this topic and tried different approaches. In the past I found myself a different topic to research each year. Previous topics included Scheme and Architectural Refactoring. Currently I am investigating Splitting the Monolith. This makes me leave my research kind of unfinished - probably it is impossible to "finish" learning at all. I want to collect what I have learned during last half year before diving into something else.

The Exercise
To experiment with Test Driven Development of user interfaces, we need some UI to build. What would be a small UI that most people know? A login dialogue. I created a repository to drive the UI of a Login Form using TDD, the Login Form TDD UI kata. Your task is to create a Login window or form or web page. Here are the requirements:

Existing Code Back End
The exercise is focused on the front end part. Let's just assume an Authentication service, facade or end point which will be simulated in the tests. It has a method authenticate() to authenticate a user based on her phone, email or user name and her password. The call returns an AuthenticationResult which indicates success and an optional message for error situations. From now on the combination of a user's phone, email or user name is called the user's lookup. Under certain conditions, the UI logic will invoke this service or back end. Calls to the back end might take some time and/or block, so these calls must done asynchronously to keep the user interface responsive.

Requirements for the Minimum Functionality
  • There is a user name input field, which is limited to 20 characters.
  • The label "Phone, email or username" is left, next to the input field.
  • There is a password field, which is limited to 20 characters.
  • The password is either visible as asterisk or bullet signs.
  • The label "Password" is left, next to the input field.
  • There is a "Log in" button in the bottom right corner of the window.
  • There is a label in a red box above the button. It is only visible if there was an error.
These requirements are just describing the UI. The more interesting part is the logic. The logic uses the Authentication back end described above.
  • When user name and password are given, button "Log in" is clicked and the back end reports success, then the form is closed.
  • When user name and password given, button "Log in" is clicked but the back end reports an error, a message in the error line is shown and the form stays open.
  • While the back end is working, the "Log in" button is disabled.
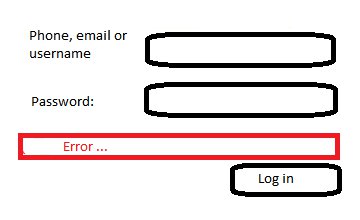
My friend Thomas said that UI requirements need wireframes. So here is a sketch. Pretty, isn't it? ;-)

Bare Login Form Sketch
More Requirements
The goal of the kata is to experiment with driving the UI using tests. Maybe you want to ignore the styling (most people do) or ignore the visual elements completely. Or maybe you want to focus specifically on styling. Clearly we need more requirements like
  • More functionality while the back end is working
  • More logic in the view itself when username or password is not given
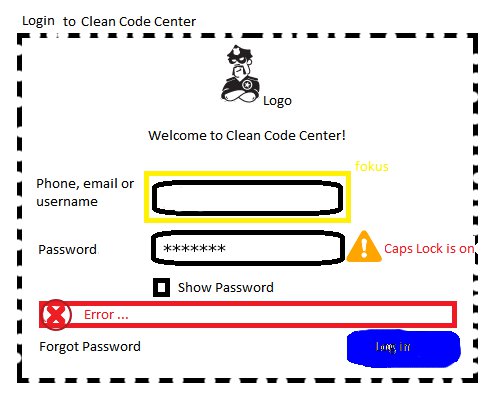
  • More UI elements like titles and logos
  • Detailed styling of all elements
  • Focus and tab order
  • Checkbox to show password
  • Caps Lock Warning
All these requirements and even more are listed in detail in LoginDialogRequirements.md inside the kata repository. The task is progressive: If you want more logic then go for more logic, for more styling add more styling. Thanks to Nick Babich, Software Testing Help and Anton Angelov this will be the most complete login you will ever build. Here is the styled sketch of the final Login:

Login Form Sketch of Everything Styled
Drive the UI of a Login Form using TDD
I created this kata to explore test driving UIs: login-form-tdd-ui-kata. Currently it contains code to get started in the following languages and UI frameworks:
  • Java/Swing
  • Java/Vaadin
  • Kotlin/Android
  • Go/raylib-go
  • JavaScript/plain browser DOM
  • JavaScript/React
Give it a try! If you do, please commit after each TDD step and share your repository so I can analyse it. Have fun!

7 January 2020

Visualising Architecture: GraphML Charting Module Dependencies

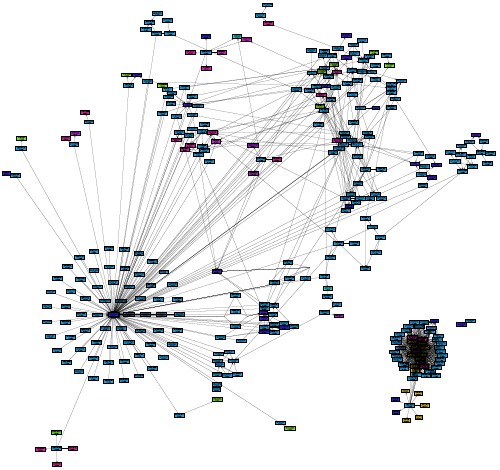
When working with existing code, analysing module dependencies helps me understand the bigger picture. For well defined modules like Eclipse OSGi or Maven there are tools to show all modules and their inter dependencies, e.g. the Eclipse Dependency Visualization tool or the Maven Module Dependency Graph Creator. For legacy technologies like COBOL and NATURAL - and probably some more platforms - we struggle due to the lack of such tools. Then the best approach is to extract the necessary information and put it into a modern, well known format. I wrote about such an approach in the past, e.g. loading references from a CSV into Neo4j for easy navigation and visualization. Today I want to sketch another idea I have used since many years: Using GraphML to chart module dependencies. For example, the following graph shows the (filtered) modules of a NATURAL application together with their dependencies in an organic layout.

Some modules of a NATURAL application in an organic layout, 2017
Process
GraphML is an XML-based file format for graphs. [...] It uses an XML-based syntax and supports the entire range of possible graph structure constellations including directed, undirected, mixed graphs, hyper graphs, and application-specific attributes. That should be more than enough to visualize any module dependencies. In fact I just need nodes and edges. My process to use GraphML is always the same:
  1. Start with defining or extracting the modules and their dependencies.
  2. Create a little script which loads the extracted data and creates a raw GraphML XML file.
  3. Use an existing graph editor to tweak and layout the diagram.
  4. Export the the diagram as PDF or as image.
Get the raw data
Extracting the module information is highly programming language specific. For Java I used my JavaClass class file parser. For NATURAL I used a CSV of all references which was provided by my client. Usually regular expressions work well to parse import, using or include statements. For example to analyse plain C, scan for #include statements (as done in Schmidrules for Application Architecture. Unfortunately there is not much documentation available about Schmidrules, which I will fix in the future.)

Create the XML
The next task is to create the XML. I use a little Ruby script to serializes a graph of nodes into GraphML. The used Node class needs a name and a list of dependencies, which are Nodes again. save stores the graph as GraphML.
require 'rexml/document'

class GraphmlSerializer
  include REXML

  # Save the _graph_ to _filename_ .
  def save(filename, graph)
    File.open(filename + '.graphml', 'w') do |f|
      doc = graph_to_xml(graph)
      doc.write(out_string = '<?xml version="1.0" encoding="UTF-8" standalone="no"?>')
      f.print out_string
    end
  end

  # Return an XML document of the GraphML serialized _graph_ .
  def graph_to_xml(graph)
    doc = create_xml_doc
    container = add_graph_element(doc)
    graph.to_a.each { |node| add_node_as_xml(container, node) }
    doc
  end

  private

  def create_xml_doc
    REXML::Document.new
  end

  def add_graph_element(doc)
    root = doc.add_element('graphml',
      'xmlns' => 'http://graphml.graphdrawing.org/xmlns',
      'xmlns:y' => 'http://www.yworks.com/xml/graphml',
      'xmlns:xsi' => 'http://www.w3.org/2001/XMLSchema-instance',
      'xsi:schemaLocation' => 'http://graphml.graphdrawing.org/xmlns http://www.yworks.com/xml/schema/graphml/1.1/ygraphml.xsd')
    root.add_element('key', 'id' => 'n1',
                     'for' => 'node',
                     'yfiles.type' => 'nodegraphics')
    root.add_element('key', 'id' => 'e1',
                     'for' => 'edge',
                     'yfiles.type' => 'edgegraphics')

    root.add_element('graph', 'edgedefault' => 'directed')
  end

  public

  # Add the _node_ as XML to the _container_ .
  def add_node_as_xml(container, node)
    add_node_element(container, node)

    node.dependencies.each do |dep|
      add_edge_element(container, node, dep)
    end
  end

  private

  def add_node_element(container, node)
    elem = container.add_element('node', 'id' => node.name)
    shape_node = elem.add_element('data', 'key' => 'n1').
      add_element('y:ShapeNode')
    shape_node.
      add_element('y:NodeLabel').
      add_text(node.to_s)
  end

  def add_edge_element(container, node, dep)
    edge = container.add_element('edge')
    edge.add_attribute('id', node.name + '.' + dep.name)
    edge.add_attribute('source', node.name)
    edge.add_attribute('target', dep.name)
  end

end
Layout the diagram
I do not try to layout the graph when creating it. Existing tools do a much better job. I use the yEd Graph Editor. yEd is a Java application. Download and uncompress the zipped archive. To get the final diagram
  1. I load the GraphML file into the editor. (If the graph is huge, yEd needs more memory. yEd is just an executable Jar - Java Archive - it can get more heap on startup using java -XX:+UseG1GC -Xmx800m -jar ./yed-3.16.2.1/yed.jar.)
  2. Then I select all nodes and apply menu commands Tools/Fit Node to Label. This is because the size of the nodes does not match the size of the node's names.
  3. Finally I apply the menu commands Layout/Hierarchical or maybe Layout/Organic/Smart. In the end it needs some trial and error to find the proper layout.
Conclusion
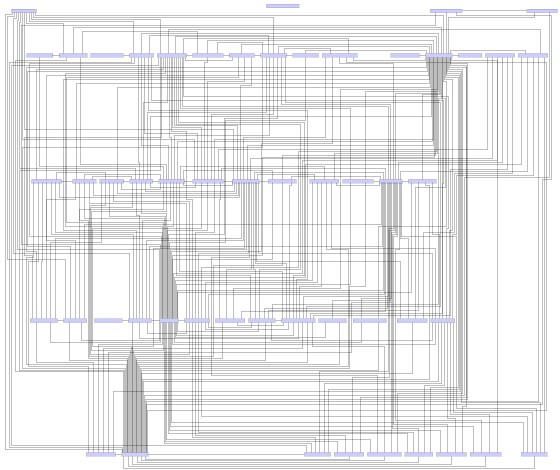
This approach is very flexible. The nodes of the graph can be anything, a "module" can be a file, a folder or a bunch of folders. In the example shown above, the nodes where NATURAL modules (aka files), i.e. functions, subroutines, programs or includes. In another example shipped with JavaClass the nodes are components, i.e. source folders similar to Maven multi module projects. The diagram below shows the components of a product family of large Eclipse RCP applications with their dependencies in a hierarchical layout. Pretty crazy, isn't it. ;-)

Components of an Eclipse RCP application in hierarchical layout, 2012