Process
GraphML is an XML-based file format for graphs. [...] It uses an XML-based syntax and supports the entire range of possible graph structure constellations including directed, undirected, mixed graphs, hyper graphs, and application-specific attributes. That should be more than enough to visualize any module dependencies. In fact I just need nodes and edges. My process to use GraphML is always the same:
- Start with defining or extracting the modules and their dependencies.
- Create a little script which loads the extracted data and creates a raw GraphML XML file.
- Use an existing graph editor to tweak and layout the diagram.
- Export the the diagram as PDF or as image.
Extracting the module information is highly programming language specific. For Java I used my JavaClass class file parser. For NATURAL I used a CSV of all references which was provided by my client. Usually regular expressions work well to parse
import, using or include statements. For example to analyse plain C, scan for #include statements (as done in Schmidrules for Application Architecture. Unfortunately there is not much documentation available about Schmidrules, which I will fix in the future.)Create the XML
The next task is to create the XML. I use a little Ruby script to serializes a graph of nodes into GraphML. The used
Node class needs a name and a list of dependencies, which are Nodes again. save stores the graph as GraphML.require 'rexml/document'
class GraphmlSerializer
include REXML
# Save the _graph_ to _filename_ .
def save(filename, graph)
File.open(filename + '.graphml', 'w') do |f|
doc = graph_to_xml(graph)
doc.write(out_string = '<?xml version="1.0" encoding="UTF-8" standalone="no"?>')
f.print out_string
end
end
# Return an XML document of the GraphML serialized _graph_ .
def graph_to_xml(graph)
doc = create_xml_doc
container = add_graph_element(doc)
graph.to_a.each { |node| add_node_as_xml(container, node) }
doc
end
private
def create_xml_doc
REXML::Document.new
end
def add_graph_element(doc)
root = doc.add_element('graphml',
'xmlns' => 'http://graphml.graphdrawing.org/xmlns',
'xmlns:y' => 'http://www.yworks.com/xml/graphml',
'xmlns:xsi' => 'http://www.w3.org/2001/XMLSchema-instance',
'xsi:schemaLocation' => 'http://graphml.graphdrawing.org/xmlns http://www.yworks.com/xml/schema/graphml/1.1/ygraphml.xsd')
root.add_element('key', 'id' => 'n1',
'for' => 'node',
'yfiles.type' => 'nodegraphics')
root.add_element('key', 'id' => 'e1',
'for' => 'edge',
'yfiles.type' => 'edgegraphics')
root.add_element('graph', 'edgedefault' => 'directed')
end
public
# Add the _node_ as XML to the _container_ .
def add_node_as_xml(container, node)
add_node_element(container, node)
node.dependencies.each do |dep|
add_edge_element(container, node, dep)
end
end
private
def add_node_element(container, node)
elem = container.add_element('node', 'id' => node.name)
shape_node = elem.add_element('data', 'key' => 'n1').
add_element('y:ShapeNode')
shape_node.
add_element('y:NodeLabel').
add_text(node.to_s)
end
def add_edge_element(container, node, dep)
edge = container.add_element('edge')
edge.add_attribute('id', node.name + '.' + dep.name)
edge.add_attribute('source', node.name)
edge.add_attribute('target', dep.name)
end
endLayout the diagramI do not try to layout the graph when creating it. Existing tools do a much better job. I use the yEd Graph Editor. yEd is a Java application. Download and uncompress the zipped archive. To get the final diagram
- I load the GraphML file into the editor. (If the graph is huge, yEd needs more memory. yEd is just an executable Jar - Java Archive - it can get more heap on startup using
java -XX:+UseG1GC -Xmx800m -jar ./yed-3.16.2.1/yed.jar.) - Then I select all nodes and apply menu commands
Tools/Fit Node to Label. This is because the size of the nodes does not match the size of the node's names. - Finally I apply the menu commands
Layout/Hierarchicalor maybeLayout/Organic/Smart. In the end it needs some trial and error to find the proper layout.
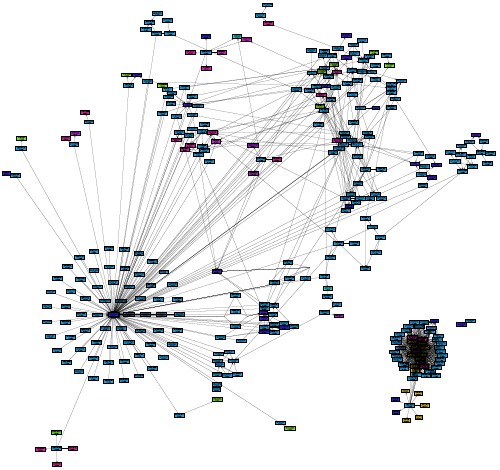
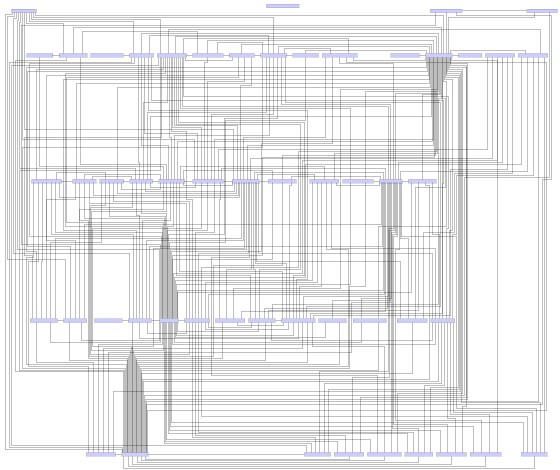
This approach is very flexible. The nodes of the graph can be anything, a "module" can be a file, a folder or a bunch of folders. In the example shown above, the nodes where NATURAL modules (aka files), i.e. functions, subroutines, programs or includes. In another example shipped with JavaClass the nodes are components, i.e. source folders similar to Maven multi module projects. The diagram below shows the components of a product family of large Eclipse RCP applications with their dependencies in a hierarchical layout. Pretty crazy, isn't it. ;-)


No comments:
Post a Comment