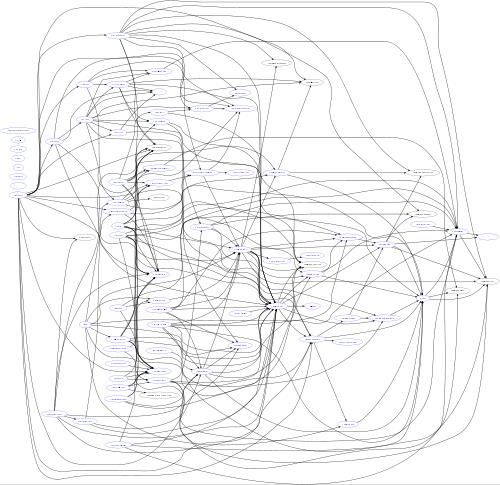
dot tool which comes with Graphviz to transform the resulting graph file into JPG, SVG etc.In a regular project there is not much use for the graph creator tool, but in super large projects there definitely is. I like to use it when I run code reviews for my clients, which involve codebases around 1 million lines of code or more. Such projects can contain up to two hundred Maven modules. Maven prohibits cyclic dependencies, still projects of such size often show crazy internal structure. Here is a (down scaled) example from one of my clients:

Looks pretty wild, doesn't it? The graph is the first step in my analysis. I need to load it into a graph editor and cluster modules into their architectural components. Then outliers and architectural anomalies are more explicit.


